If you're working with multithreaded critical embedded software, you probably want to know how your task scheduling affects the execution behavior of your code. You may even need to provide evidence of this to certify your software. In this post, we show how to perform task scheduling analysis with RapiTask without having to instrument the tasks in a system directly.
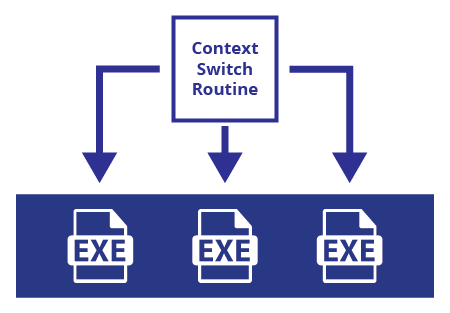
We'll demonstrate this using an example system that includes multiple tasks (individual executables) and a context switch routine that prioritizes and schedules them (Figure 1).

Figure 1. System architecture
RapiTask works by adding instrumentation to the source code, so that when it is executed, a routine is called which logs and timestamps the execution.
To produce timing data in our example system, we instrument the context switch routine, but not the tasks themselves; Figure 2 shows an example of this.
void TaskSwitchContext( void )
{
RVS_I(5); // Context switch out
// Find the highest priority task pending and switch to it
TopReadyPriority = TopPriority;
while( ReadyTasksLists[ TopReadyPriority ].Pending == 0 )
{
TopReadyPriority -= 1;
}
TaskSwitchFrames(CurrentTask, ReadyTasksLists[ TopReadyPriority ]);
CurrentTask = ReadyTasksLists[ TopReadyPriority ];
RVS_I(6); // Context switch in
RVS_I(CurrentTask.Ident); // New task ID
}
Figure 2. Instrumenting the context switch routine; RVS instrumentation highlighted
Next, we run tests on the system with RapiTask to produce reports on the execution time behavior of the code during each test (Figure 3).

Figure 3. RapiTask execution time behavior chart
This gives us data on every time each task starts execution, but doesn't tell us whether this is due to a new invocation of the task or resuming a previous execution that was pre-empted. To get this information, we have to take into account the system's scheduling priorities.
The names of the tasks highlighted in our example represent their priority; High has the highest priority, and Low has the lowest. Using this knowledge and the RapiTask report shown in Figure 3, we can safely infer when Medium is first invoked, when it resumes execution after being pre-empted by High , and when it finishes execution; these points are marked on Figure 3.
If you're an embedded engineer with a detailed understanding of your system's scheduling behavior, you can use RapiTask reports to easily identify issues in your code, for example cycle slips. Let's imagine that each time Medium is invoked, it must finish each execution within 50 ms. Using our knowledge of the system's priorities, we can infer when each invocation of Medium starts and ends and use this to identify cycle slips.
The approach to collecting execution time data described here means you don't need to instrument the tasks you're analyzing. This is useful when you can't instrument tasks (for example because you don't have access to the source code, only the executable, in a system like the one in Figure 1), or if you want to avoid the overheads of instrumenting them (for example because your target is resource-constrained).
If you want to know more about RapiTask, contact us or request a trial.

 Rapita Systems launches MACH178 Foundations for multicore DO-178C compliance
 Collins Aerospace and Rapita present award winning paper at DASC 2024
 Embedded Office GmbH & Co. KG and Rapita Systems announce strategic partnership
 Control Coupling Basics in DO-178C
 Components in Data Coupling and Control Coupling
 The ‘A’ Team comes to the rescue of code coverage analysis
 Why there’s no standard approach for Data Coupling and Control Coupling Analysis
 DO-278A Guidance: Introduction to RTCA DO-278 approval
 ISO 26262
 Data Coupling & Control Coupling
 Verifying additional code for DO-178C
 DO-178C Multicore In-person Training (Munich)
 DO-178C Multicore In-person Training (Fort Worth, TX)
 DO-178C Multicore In-person Training (Toulouse)


