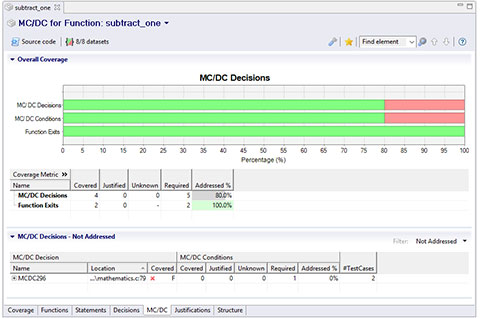
RVS Treemaps let you you visualize your RVS results graphically in the context of your program's hierarchical structure. This helps you to identify anomalies such as missing coverage or failed tests at a glance.
To help you understand your results, you can choose to color the treemap view (in a gradient) by various metrics, depending on which RVS tools you're using:
- For all compatible RVS tools, you can color treemaps based on the number of lines of code in each folder/file/function, by the density of instrumentation points added to your code by RVS, and by the complexity and complexity density of your code.
- For RapiTest, you can color treemaps based on whether tests passed or failed.
- For RapiCover and RapiCoverZero, you can color treemaps based on the coverage achieved from your tests based on different coverage metrics e.g. decision coverage. Where you have achieved 100% coverage through the use of justifications, this is clearly highlighted.
- For RapiTime and RapiTimeZero, you can color treemaps based on whether blocks and calls in each folder/file/function have been tested.
RVS Treemaps let you easily navigate through your report so you can quickly find the information you're looking for:
- You can easily filter the Treemaps view to only specific areas of your code by zooming further into specific folders or files.
- By synchronizing the Treemaps view with your results in the RVS Project Manager, you can view both overview and detailed results at the same time.
- When you click on a folder, file or function in the Treemaps view while it is synchronized your report, you can quickly jump to that in the report.
Feature applies to:

 Rapita System Announces New Distribution Partnership with COONTEC
 Rapita partners with Asterios Technologies to deliver solutions in multicore certification
 SAIF Autonomy to use RVS to verify their groundbreaking AI platform
 What does AMACC Rev B mean for multicore certification?
 How emulation can reduce avionics verification costs: Sim68020
 Multicore timing analysis: to instrument or not to instrument
 How to certify multicore processors - what is everyone asking?
 Certifying Unmanned Aircraft Systems
 DO-278A Guidance: Introduction to RTCA DO-278 approval
 ISO 26262
 Data Coupling & Control Coupling
 DASC 2025
 DO-178C Multicore In-person Training (Fort Worth, TX)
 DO-178C Multicore In-person Training (Toulouse)
 HISC 2025


