The ultimate data logging solution
Automatically collect and timestamp execution data from embedded systems
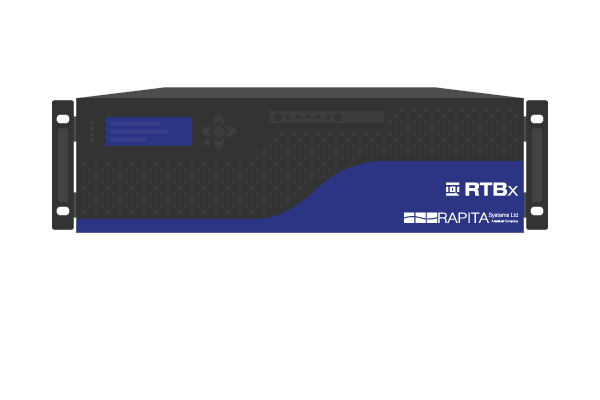
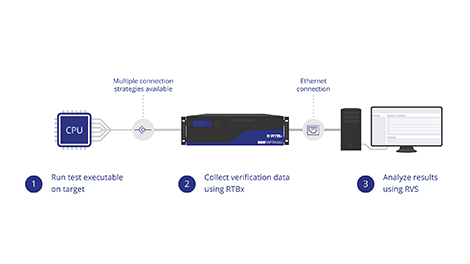
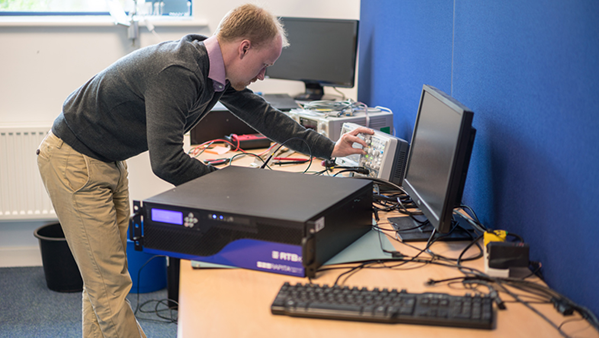
The RTBx automatically collects and timestamps execution data from embedded systems while they run. These results can be analyzed by RVS to verify the behavior of your application.
With flexible options for interfacing with your target hardware, the RTBx lets you collect data produced at a high rate that you can trust and use to verify your application.
Produce traces for RVS analysis
The RTBx lets you collect traces that can be used by RVS to verify your system’s behavior. This supports your functional testing (RapiTest), structural coverage analysis (RapiCover), execution time analysis (RapiTime), and lets you visualize the scheduling behavior of your system (RapiTask).
With streamlined integrations, it’s easy to get set up collecting data from your target with the RTBx and analyzing your data through an automated RVS environment.
Easy to get started
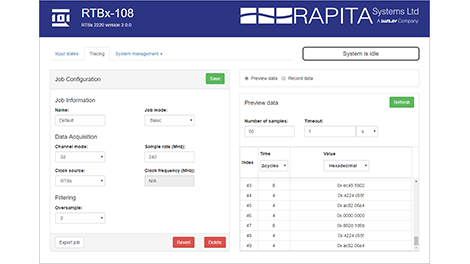
It’s easy to get started collecting data with the RTBx. With a web-based manager, you can easily configure your collection settings through a graphical interface.
You can start the RTBx up remotely through the web interface or configure it to start up automatically when you run your code through simple build scripts.
Reduce post-processing effort
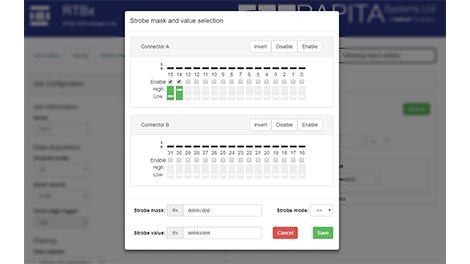
The RTBx reduces the effort needed to process your data by providing a range of filtering options with which you can automatically filter the data collected from your target as it’s captured.
By specifying pin signatures and masks, you can ensure that you only capture the relevant data, eliminating unnecessary effort later in your analysis.
Product features
-
High-speed continuous processing Log and timestamp trace data produced at high rates for days on end.Discover this feature
-
Automatically timestamp data Remove the need for on-target timestamping procedures or hardware that causes bottlenecks in your testing.Discover this feature
-
Flexible connection strategies Connect to almost any embedded target with a range of connection strategies.Discover this feature
-
Web-based manager Manage the RTBx easily through a web client.Discover this feature
-
Automated tracing Integrate into your existing continuous build environment to collect data from tests automatically.Discover this feature
-
On-the-fly filtering Reduce downstream data processing time by filtering data as it is collected.Discover this feature
Downloads
News & Blog
Specifications
|
Specification |
RTBx 2220 |
|---|---|
|
Signal input |
Up to 32 bit |
|
Maximum sustained tracing rate |
250 million ipoints/second |
|
Minimum ipoint separation |
4 ns |
|
Sampling frequency |
250 MHz |
|
Storage capacity |
500 GB† |
|
Typical continuous tracing duration |
Days |
|
Electrical signal |
LVDS/TTL‡ |
†Additional capacity available on request. ‡Using an adapter.
If your requirements exceed the stated specifications, contact us for options.
Frequently asked questions
-
What if I don’t have a spare I/O port?
You can connect RTBx to an address bus that runs at up to 250 MHz. To do this, you must reserve a range of addresses for ipoints, with one bit reserved to indicate that the value on the address bus is an ipoint. The ipoint instrumentation writes a value to a specific address in that region to denote a specific ipoint. This approach reduces the maximum trace duration of the RTBx.
-
Will the RTBx support my processor running at x MHz?
This depends on the number of CPU cycles it takes to output successive ipoints, and the rate ipoints are written at. For example, RTBx 2220 can collect trace data via an I/O port with a minimum separation of 4 ns (250 MHz). This model can therefore support a 1 GHz CPU that outputs trace data once every 4 cycles.
-
What is the “maximum sustained tracing rate”?
This is the maximum tracing rate that can be sustained over time, calculated from the number of ipoints the RTBx can process per second. The RTBx can support a higher tracing rate for short periods of time, provided that the minimum separation between instrumentation points is met.
-
How do I collect timestamped data with the RTBx?
The RTBx automatically timestamps data it collects, using either an internal clock or that on embedded hardware. This removes the need to configure a timestamping procedure on the embedded target itself, which would incur code size and execution time overheads.
Compared to other hardware that can be used for timestamping such as debuggers and logic analyzers, the RTBx can collect trace data for far longer, meaning that it doesn't become a bottleneck in your testing.
-
How do I connect RTBx to my target?
We supply standard data cables, an adapter, and flying leads to connect RTBx to LVDS or TTL I/O ports. If your target hardware uses non-standard pins or electrical signalling, we provide advice on the best way to connect RTBx to your target, and can develop high performance custom cables to meet your needs.
-
What is the RTBx?
The RTBx is a data logger that provides a cost-effective, easy-to-use solution for collecting and timestamping long streams of verification data from software tests run on embedded hardware. It is target-independent, supporting a wide variety of target architectures, and provides an excellent way of collecting trace data for use by RVS.

 RVS 3.24 accelerates multicore software verification
 Rapita Systems and Avionyx Announce Strategic Partnership to Offer Best-in-class Avionics Solutions
 Rapita System Announces New Distribution Partnership with COONTEC
 Retro gaming with the Sim68020
 RVS gets a new timing analysis engine
 How to measure stack usage through stack painting with RapiTest
 What does AMACC Rev B mean for multicore certification?
 How to achieve multicore DO-178C certification with Rapita Systems
 How to achieve DO-178C certification with Rapita Systems
 Certifying Unmanned Aircraft Systems
 DO-278A Guidance: Introduction to RTCA DO-278 approval
 Avionics Certification Q&A: CERT TALK
 XPONENTIAL 2026
 DO-178C Multicore In-person Training (Heathrow)
 Avionics and Testing Innovations


